How often do you need to fly a quarry to catch a fleet swap before dealer data does?
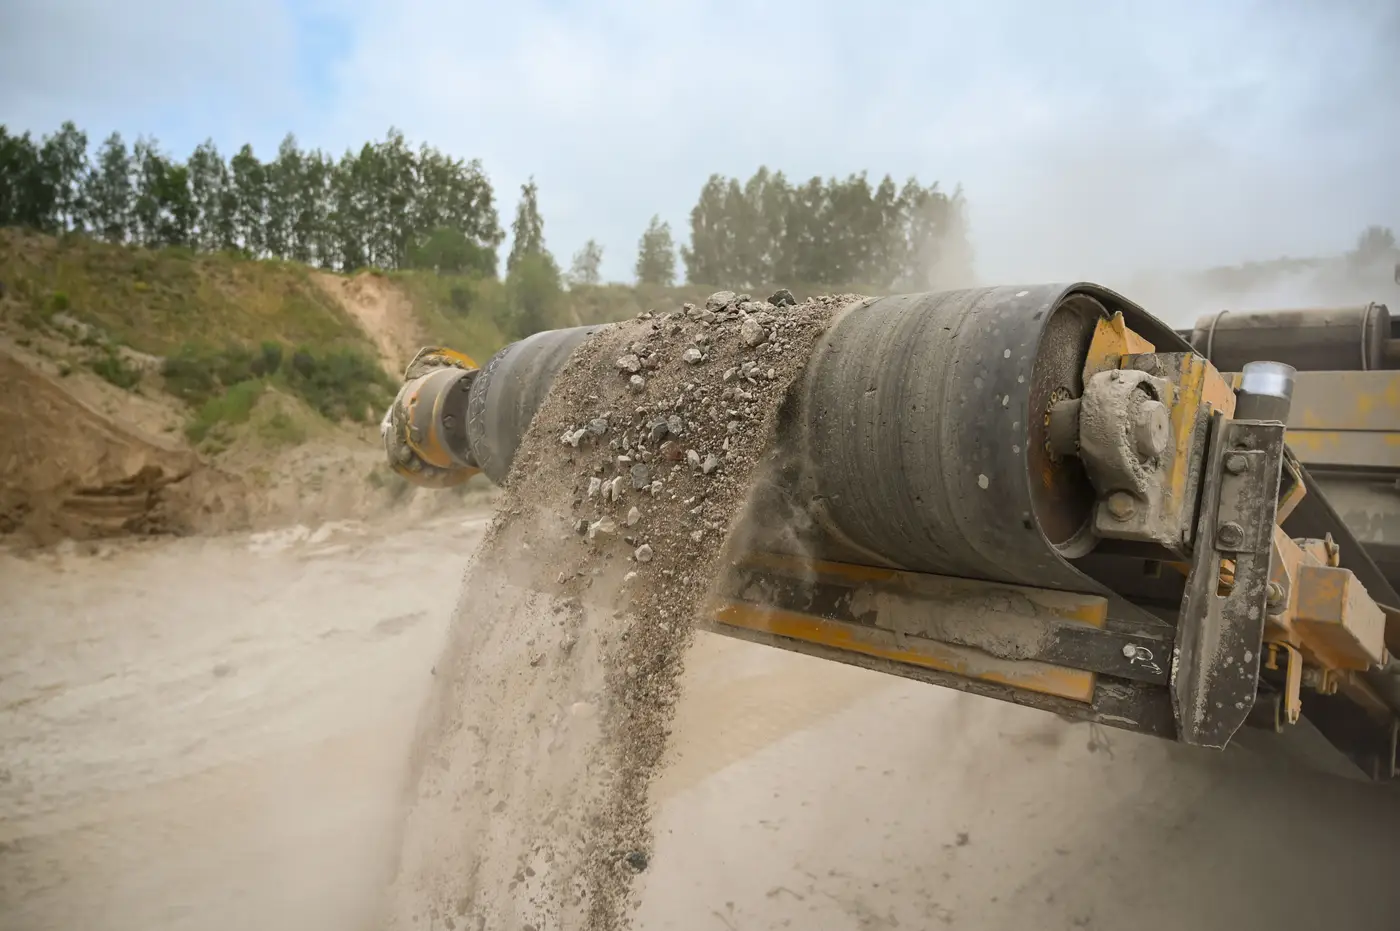
The lag is built into how dealer data gets made
Dealer sell-through reports, floor plan financing data, warranty registrations: all of it reflects a transaction, not a machine standing on a pad. A unit has to be invoiced, financed, and entered into a system before it shows up anywhere an OEM analyst can see it. For a new machine sold through a franchised dealer, that's often a 60 to 120 day gap between "the crusher arrived at the pit" and "the sale posted." For a used machine moved private-party, or a competitor's unit that never touches your dealer network at all, it may never show up in your data in any useful form.
That's the structural problem with using dealer channel data as your main read on fleet turnover. It tells you what your own network sold, after the fact, with a reporting cycle that's usually compiled monthly or quarterly and reviewed even later than that. By the time a regional sales manager flags a pit that swapped its primary crusher, the unit's been running for the better part of two quarters.
Why quarterly imagery lands ahead of it, not just alongside it
Crusher and loader fleets at a working pit don't turn over on a weekly cadence. A quarry replaces a jaw crusher or a wheel loader on a multi-year cycle tied to wear, financing terms, and production targets, not on a schedule that needs to be caught in real time. So monthly flights would mostly show you the same iron sitting in the same spot, which is money spent for no new signal.
Quarterly is the cadence that matches how fast equipment at a pit changes while still landing ahead of when that change shows up anywhere else. A pass in March and a pass in June, set side by side, show you a new haul truck in the loadout area or an idle screen that's been parked since the last visit. None of that depends on an invoice clearing or a warranty card getting mailed in. The equipment is either standing there or it isn't, and a satellite doesn't care who sold it.
The part that matters most for sizing replacement demand: a used crusher showing up at a pit, paired with a jump in extraction activity on the next pass, is a leading indicator. It says something is happening at that site before any purchase order, parts request, or warranty claim related to it reaches an OEM's own systems. By the time that activity surfaces in sell-through numbers, the buying decision is already made and the window to act on it as a signal is closed.
What this changes for a regional demand read
If you're sizing replacement demand across a region's pits, dealer data alone tells you about your own historical wins. It's a lagging, channel-limited view. A standing visual record of what's parked at each site, checked on a fixed quarterly rhythm, gives you a read on the whole fleet regardless of who sold it or how the deal was structured. That's the gap Quarry Equipment Census is built to close: a quarterly inventory of the crushers, screens, loaders and haulers at each pit, linked to a change read against extraction activity, so a new unit or an idled one gets flagged as a demand signal instead of waiting to surface in next quarter's sales report.
One flight a quarter won't catch the day a deal closes. It will catch the machine before your dealer data does, which is the point.
If that's the kind of lead time your team has been missing, it's worth a look at what a standing quarterly list of a region's pits would show.